3925 名心衰合并房颤重症患者数据 乳酸与血红蛋白比值进入院内死亡预测模型
11 月 14 日发表于《科学报告》的一项研究以重症监护数据库构建心力衰竭合并心房颤动患者的院内死亡预测模型。研究作者为 Alioglu、Kahraman Ay 与 Isleyen。开发队列来自 MIMIC-IV v3.1 数据库,共 3925 人,其中死亡 760 人,占 19.4%;外部验证队列来自 eICU-CRD v2.0 数据库,共 403 人,其中死亡 125 人,占 31.0%。
研究以进入 ICU 后 6 小时为地标时间点,考察乳酸、尿素氮、血红蛋白三项指标及其比值。调整后分析显示,乳酸与血红蛋白比值在两个队列中均与死亡相关;尿素氮与血红蛋白比值在外部验证中的估计不精确。
锁定的 XGBoost 模型在外部验证中的 AUC 为 0.668,95% 置信区间为 0.610 至 0.723,比临床变量加该比值的逻辑回归模型高 0.053,95% 置信区间为 0.002 至 0.101;与临床变量加三项原始指标的逻辑回归模型(AUC 为 0.672)相比无明确优势,差值为负 0.004,95% 置信区间为负 0.042 至 0.034。去掉两个比值后,AUC 仅变化 0.0005。本研究无资助,伦理批准来自 Bezmialem Foundation University,批准日期为 2026 年 3 月 31 日。
Lactate-to-Hemoglobin Ratio Features in Mortality Model Built on 3,925 Critically Ill Patients With Heart Failure and Atrial Fibrillation
A study published November 14 in Scientific Reports built a hospital mortality prediction model for critically ill patients with heart failure and atrial fibrillation using intensive care databases. The authors are Alioglu, Kahraman Ay, and Isleyen. The development cohort, from the MIMIC-IV v3.1 database, comprised 3,925 patients, of whom 760 died, or 19.4 percent; the external validation cohort, from the eICU-CRD v2.0 database, comprised 403 patients, of whom 125 died, or 31.0 percent.
Using a landmark time of six hours after ICU admission, the study examined lactate, blood urea nitrogen, and hemoglobin, together with ratios formed from them. In adjusted analyses, the lactate-to-hemoglobin ratio was associated with mortality in both cohorts, while estimates for the urea nitrogen-to-hemoglobin ratio were imprecise externally.
The locked XGBoost model reached an external AUC of 0.668, with a 95 percent confidence interval of 0.610 to 0.723, which was 0.053 higher than a logistic regression model using clinical variables plus the ratio, with a 95 percent confidence interval of 0.002 to 0.101. Against a logistic regression model using clinical variables plus the three raw markers, with an AUC of 0.672, there was no clear advantage, the difference being minus 0.004 with a 95 percent confidence interval of minus 0.042 to 0.034. Removing both ratios changed the AUC by only 0.0005. The study received no funding; ethics approval was granted by Bezmialem Foundation University on March 31, 2026.
来源:《科学报告》
发布:GSM·美国(发布链接)
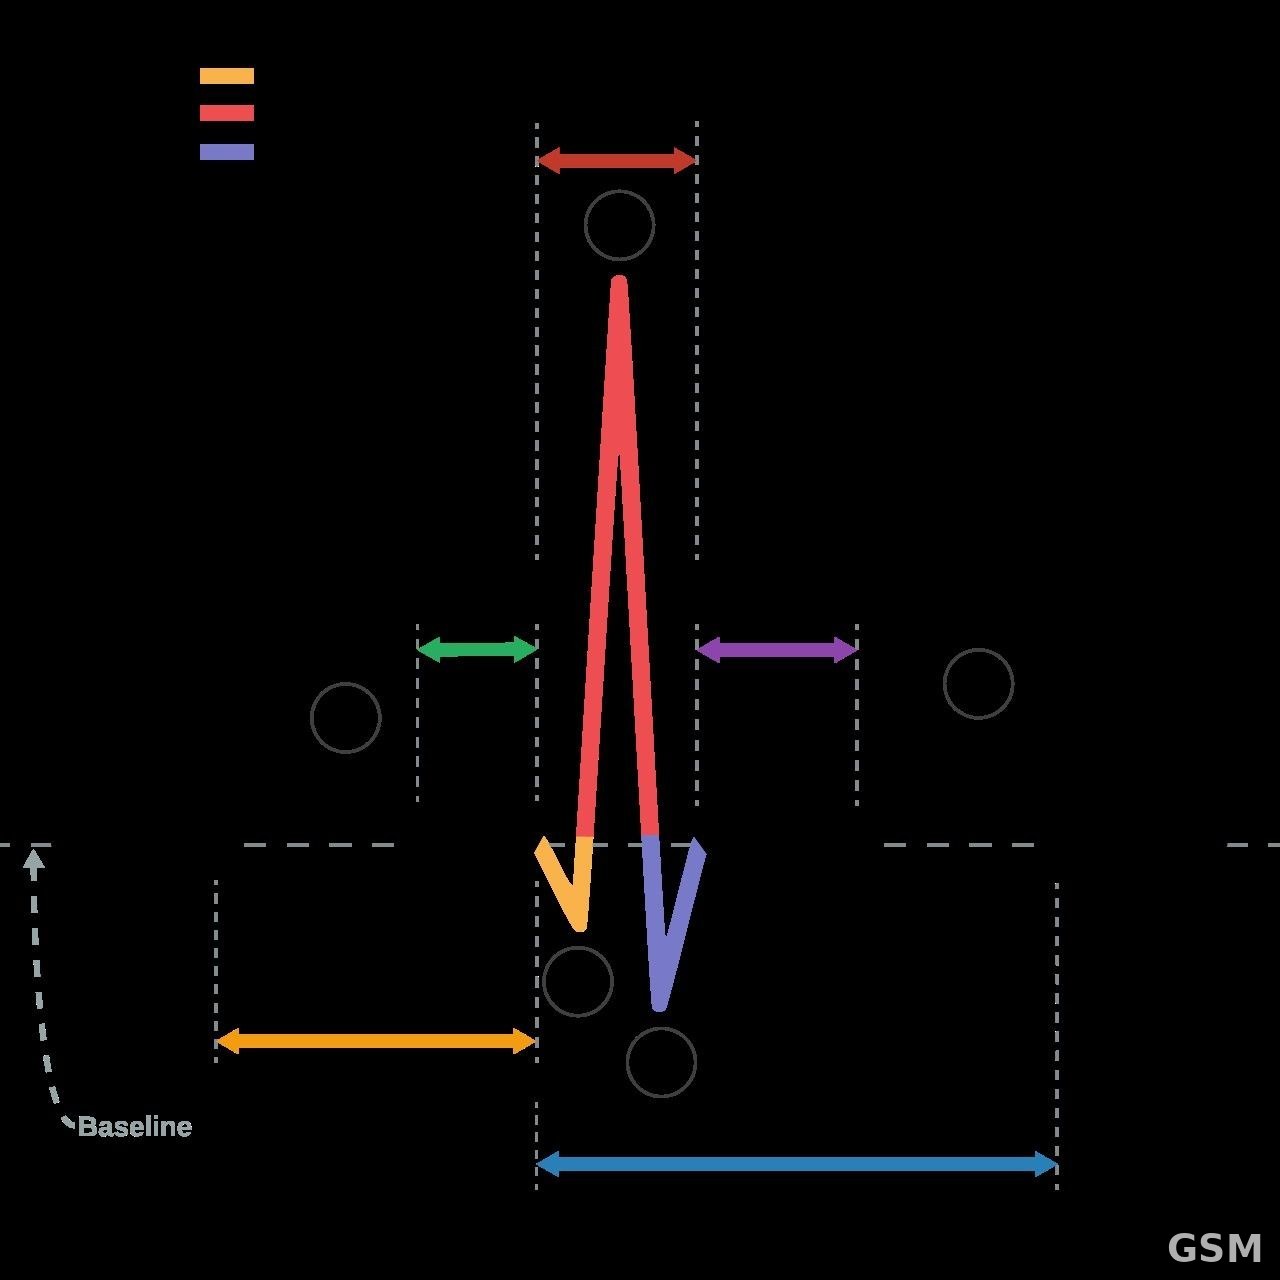
图片来源:图:正常窦性心律的心电图波形示意图,标注了 P 波、QRS 波群与 T 波。来源:Anthony Atkielski (Agateller),Wikimedia Commons,Public domain。 / Photo: Diagram of a normal sinus rhythm electrocardiogram waveform, showing the P wave, QRS complex and T wave. Source: Anthony Atkielski (Agateller), Wikimedia Commons, Public domain.
GSM Global · 本篇英文版 English edition of this story