交通统计局发布11月供应链指标更新:港口、铁路、卡车与运价多组数据刷新
美国交通部交通统计局(Bureau of Transportation Statistics,BTS)11月4日发布2026年11月供应链指标更新,刷新全国供应链与货运指标的多组数据,供政府、企业与公众跟踪货物流动状况。
这套指标分四部分:港口闸内数据、港口闸外数据、货运流动,以及运输劳动力与运力紧张程度。本月更新的指标包括停靠美国港口的集装箱船运力、装载进口集装箱、装载与空载出口集装箱数量、在美国港口外锚泊及等待泊位的集装箱船数量等港口数据。
铁路与公路方面,本月更新了列车平均速度、在线铁路车辆数、各级铁路终点站平均停留时间、铁路非联运与联运装载量、10处瓶颈路段的卡车平均速度与规划时间指数,以及洛杉矶/长滩港与纽约/新泽西港周边的卡车速度数据。
价格与宏观指标方面,本月更新了美国至上海与上海至洛杉矶的货运运价、货运运输服务指数、卡车运输生产者价格指数、柴油售价与柴油生产者价格指数、下行粮食驳船运价、个人消费支出与企业库存销售比等。
交通统计局自2020年起按白宫指示追踪供应链指标,交通部为此召集跨部门工作组,成员包括交通部各相关部门及农业部、能源部、商务部与劳工部。
(来源:美国交通统计局)
BTS Releases November 2026 Update of Supply Chain Indicators
The U.S. Department of Transportation's Bureau of Transportation Statistics (BTS) on November 4 released its November 2026 update of the nation's Supply Chain Indicators, refreshing a wide range of data on supply chain and freight conditions.
The indicators are organized into four sections: Port Data - Inside the Gate, Port Data - Outside the Gate, Freight Movement, and Transportation Labor and Capacity Tightness. This month's updates include the capacity of containerships calling at U.S. ports, loaded import containers, loaded and empty export containers, and the numbers of containerships anchored off U.S. ports and awaiting berths.
Rail and highway updates include average train speed, rail cars online, average dwell times at Class I railroad terminals, rail non-intermodal carloads and intermodal units, average truck speeds and planning time indexes at 10 bottleneck locations, and truck speeds around the Port of Los Angeles/Long Beach and the Port of New York/New Jersey.
Price and macroeconomic updates include freight rates from the U.S. to Shanghai and from Shanghai to Los Angeles, the Freight Transportation Services Index, producer price indexes for trucking and diesel fuel, U.S. diesel sales prices, downbound grain barge rates, personal consumption expenditures and the total business inventory-to-sales ratio.
BTS began tracking supply chain indicators in 2020 at the direction of the White House. The Department of Transportation convenes the interagency working group behind the data, which includes DOT modes and the U.S. Departments of Agriculture, Energy, Commerce and Labor.
(Source: U.S. Bureau of Transportation Statistics)
来源:美国交通统计局
发布:GSM·美国(发布链接)
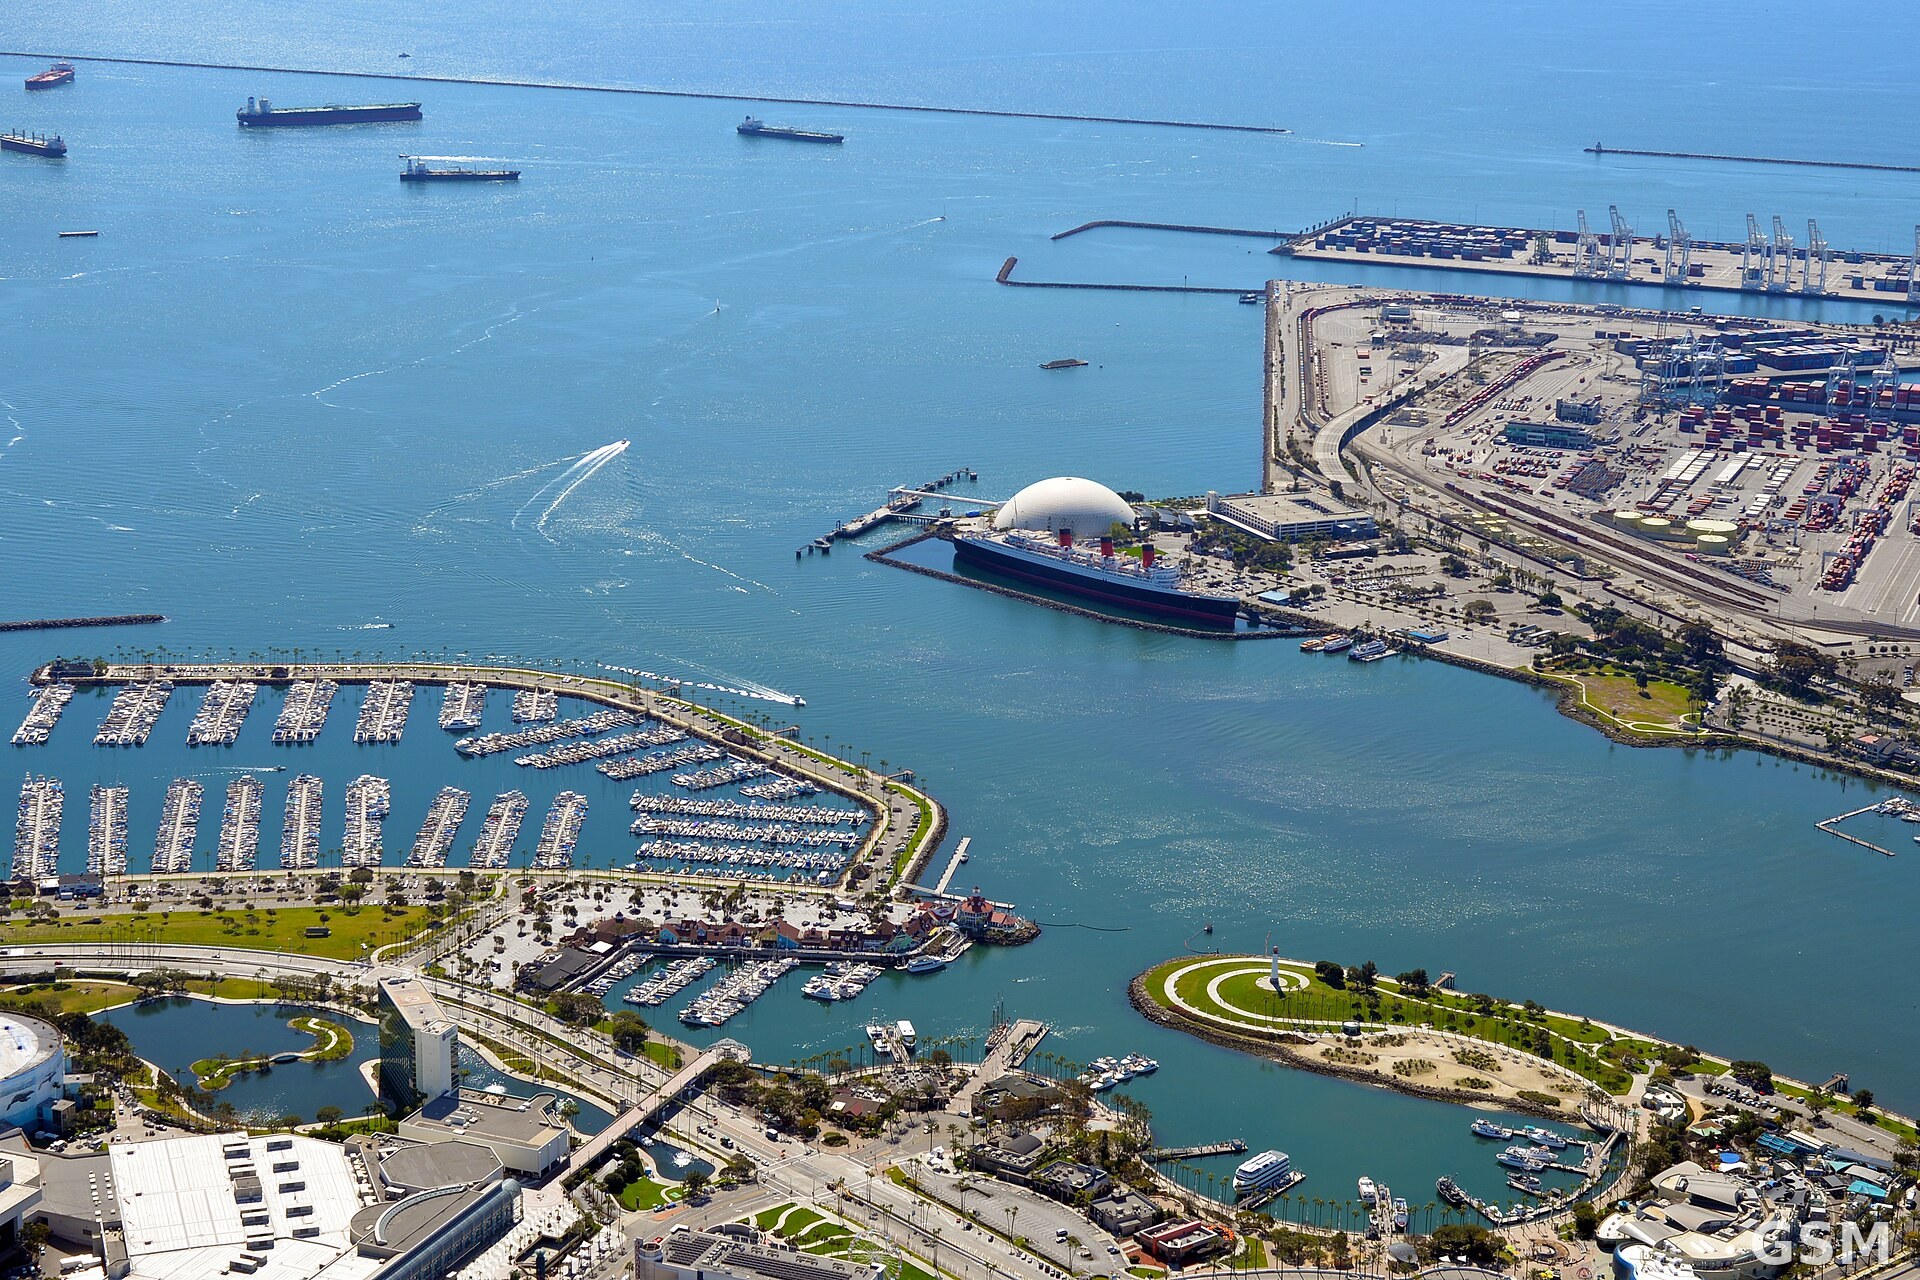
图片来源:图:长滩港集装箱码头航拍。Don Ramey Logan 摄,CC BY-SA 4.0,经 Wikimedia Commons。 / Photo: Aerial view of the Port of Long Beach container terminals. Photo by Don Ramey Logan, CC BY-SA 4.0, via Wikimedia Commons.
GSM Global · 本篇英文版 English edition of this story